Received: Thu 07, Sep 2023
Accepted: Wed 27, Sep 2023
Abstract
Background: Cervical lymphadenopathy is common in children with diverse causes varying from benign to malignant, their similar manifestations make differential diagnosis difficult. This study intended to investigate whether radiomic models using conventional magnetic resonance imaging (MRI) could classify pediatric cervical lymphadenopathy. Methods: A total of 419 cervical lymph nodes (LNs) from 146 patients, belonging to four common causes (kikuchi disease, reactive hyperplasia, suppurative lymphadenitis and malignancy), were randomly divided into training and testing sets at a ratio of 7:3. For each LN, 1218 features were extracted from T2-weighted images. Then the least absolute shrinkage and selection operator (LASSO) model were used to select the most relevant ones. Two models were built using support vector machine classifier, one was to classify benign and malignant LNs and the other further distinguished four different diseases. The performance was assessed by receiver operating characteristic curves and decision curve analysis. Results: By LASSO, 20 features were selected to construct a model to distinguish benign and malignant LNs, which achieved an area under the curve (AUC) of 0.89 and 0.80 in the training and testing set respectively. Sixteen features were selected to construct a model to distinguish four different cervical lymphadenopathies. For each etiology (kikuchi disease, reactive hyperplasia, suppurative lymphadenitis and malignancy respectively), an AUC of 0.97, 0.91, 0.88 and 0.87 was achieved in the training set, and an AUC of 0.96, 0.80, 0.82 and 0.82 was achieved in the testing set. Conclusion: MRI-derived radiomic analysis provides a promising noninvasive approach for distinguishing cervical lymphadenopathy in children.
Keywords
Cervical lymphadenopathy, radiomics, kikuchi disease, children
1. Introduction
Pediatric cervical lymphadenopathy is a common clinical finding with diverse causes varying from benign to malignant. The lymphatic system undergoes rapid development during childhood and reaches its peak at puberty. Consequently, the lymph nodes (LNs) may enlarge under physiological conditions. It is reported that around 28% of healthy school children had palpable LNs in the neck. Furthermore, childhood is a stage at which respiratory tract infections are more likely to occur, cervical LNs would swell up in response to a bacterial or viral infection [2, 3]. Notably, head and neck malignancies account for 12% of all pediatric malignancies [4], common types include lymphoma, thyroid carcinoma, and metastatic nasopharyngeal carcinoma, with persistent enlargement of LNs as an early warning sign [5, 6]. Other idiopathic cause like kikuchi disease, which shows a growing trend among asian children, is also characterized by enlarged cervical LNs with a benign and self-limiting process but is easily confused with lymphoma clinically and histologically [7].
However, the differential diagnosis of pediatric cervical lymphadenopathy is quite challenging due to their overlapping nonspecific manifestations [8], pathological confirmation by biopsy is considered as the gold standard. Currently, there is still no consensus on indication and timing of biopsy; parents still tend to hesitate because of the invasive nature of the surgery, their concerns include the impact general anesthesia has on children’s developing brain, risk of incision infection and surgery costs.
For this reason, noninvasive imaging tools are becoming more and more valued. With the advantage of superior soft tissue contrast, multi-angle scanning and no radiation damage, MRI might outperform ultrasound and computed tomography (CT) to some extent. Recently, MRI-based radiomics models have already been applied in the field of head and neck imaging, showing good performance in prediction of LN metastasis, extra-nodal extension status and outcome prediction in patients with malignancy [9-13]. To our knowledge, benign cervical lymphadenopathy was not covered in current MRI-based radiomics model, and studies on pediatric patients are lacking.
Therefore, the aim of this study was to develop and validate radiomics models based on conventional MRI axial T2 scans to classify cervical lymphadenopathy in children.
2. Materials and Methods
2.1. Study Cohorts
Ethical approval was obtained and the informed consent requirement was waived. All patients met the following inclusion criteria: i) aged 0-18 years; ii) underwent neck MRI examination because of cervical lymphadenopathy; iii) with enlarged LNs with shortest diameter greater than 1.0 cm or largest diameter greater than 1.5 cm on axial images; iv) a histologically confirmed diagnosis. The exclusion criteria were as follows: i) poor image quality due to apparent motion artifacts; ii) previous treatment (such as radiotherapy, chemotherapy, interventional therapy, or LN biopsy surgery). Through consecutive enrollment, we found the most common causes were reactive hyperplasia, suppurative lymphadenitis, kikuchi disease and malignancy, then disease groups with very few patients (< 10 people) were eliminated. Ninety-two patients in hospital 1 were collected from January 2015 to August 2022 and fifty-four patients in hospital 2 were collected from January 2017 to December 2022. The general clinical data of patients were collected from medical records.
2.2. MRI Technique and Post-Processing
MRI data were acquired on three 3.0T MR scanners (Siemens, Philips, or GE medical systems) using a 64-channel head and neck coil on axial T2-weighted sequences. The scanning parameters were shown in (Supplementary Material). To reduce the bias caused by the variability of imaging parameters and scan conditions of different MRI machines, all images were resampled into 1×1×1 mm3 and z-score normalization was used to eliminate the batch effect before radiomics feature extraction.
2.3. Segmentation and Feature Extraction
The volume of interests (VOIs) were manually and independently segmented using ITK-SNAP (Version 3.8.0) by two radiologists (with 2 and 8 years of experience respectively) who were blinded to pathologic diagnosis and clinical information. VOIs were determined along the border of LN on each consecutive slice and then reconstructed in a three-dimensional way. When LNs were fused in an ill-defined mass, it was considered as a single VOI. Twenty VOIs were randomly selected to test reproducibility between radiologists. Intra-class correlation coefficients were calculated to assess the robustness of the radiomic features. Excellent consistency was defined as an intraclass correlation coefficient greater than or equal to 0.75.
For each VOI, a total of 1218 radiomics features were extracted using pyradiomics (Link 1) which is an open-source python package that adheres to the IBSI guidelines [14]. The extracted features can be divided into four sets: i) first-order statistics; ii) shape-based (2D, 3D) features; iii) texture features including gray-level co-occurrence matrix (GLCM), gray-level size zone matrix (GLSZM), gray-level dependence matrix (GLDM), and gray-level run length matrix (GLRLM); iv) higher-order features using laplacian of gaussian filter (sigma=2.0, 3.0, 4.0 and 5.0 mm) and wavelet transform filter with all possible combinations of high (H) or low (L) pass filter in each of the three dimensions (HHH, HHL, HLH, LHH, LLL, LLH, LHL, HLL).
2.4. Feature Selection and Model Building
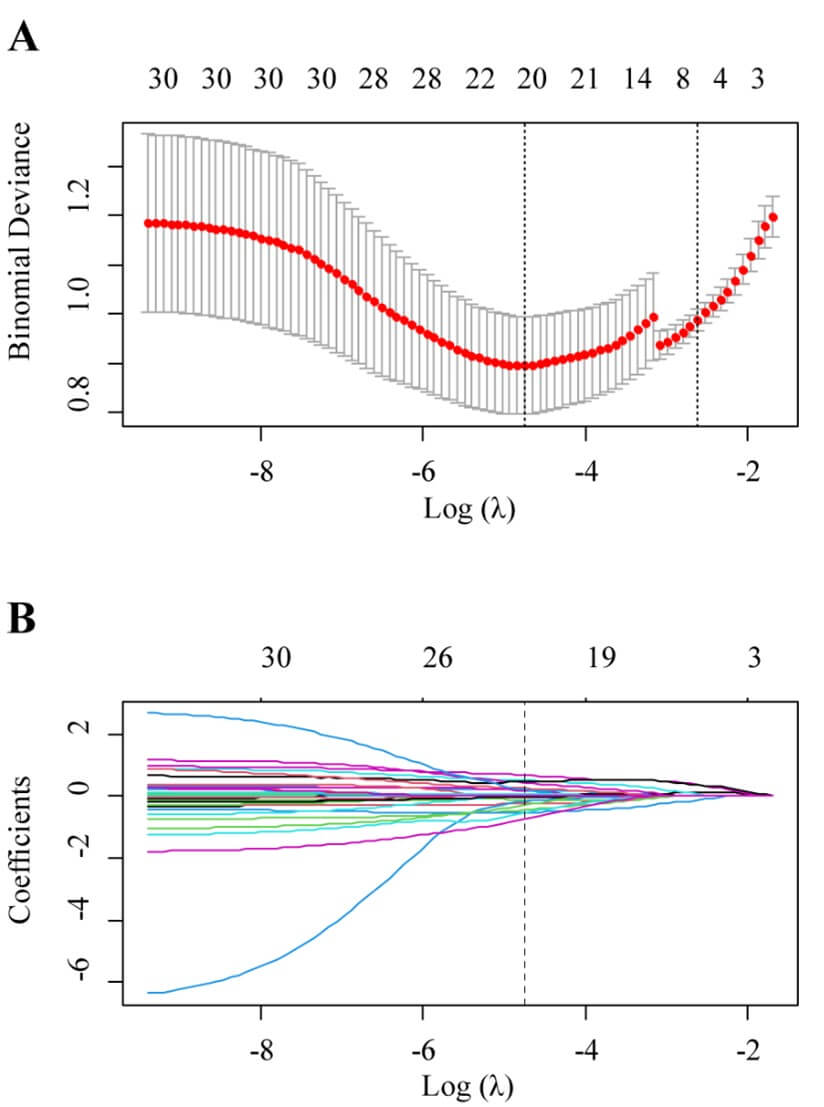
The VOIs were randomly assigned to training (70%) or testing dataset (30%). Considering the imbalance of the disease type, synthetic minority over-sampling technique was used to synthesize new minority samples to get a balanced dataset. Then features with spearman correlation coefficients larger than 0.75 were excluded to eliminate redundant features. Next, one-way analysis of variance was carried out to select statistically significant variables (p < 0.05). Then the least absolute shrinkage and selection operator logistic regression (LASSO) was used to select the most useful predictive features from the remaining features. In order to avoid potential bias, the optimal penalization coefficient lambda (λ) was set by ten-fold cross-validation. Radiomics features with non-zero coefficients were finally selected to construct a radiomics signature (Rad-score) which was calculated using a linear combination of selected features and their coefficients.
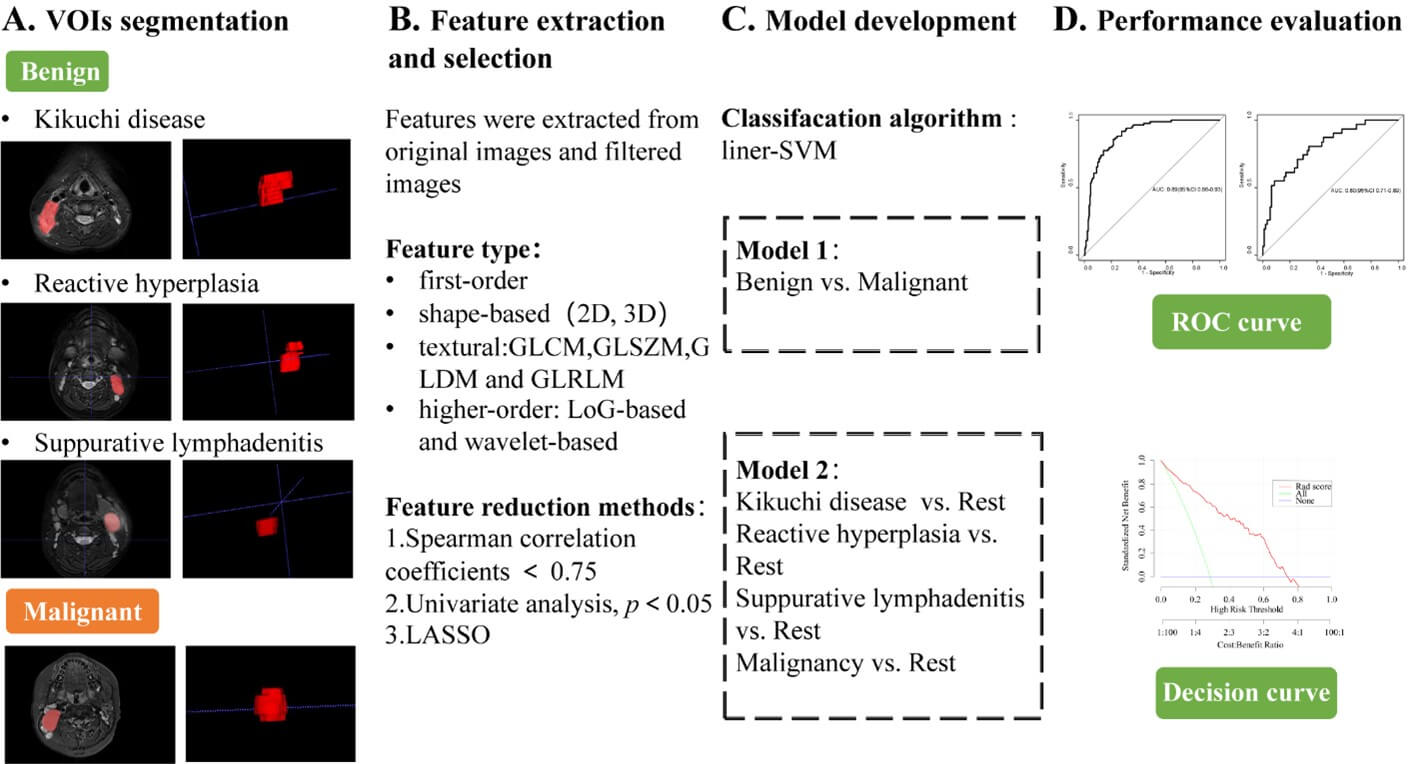
Two MRI radiomics models were constructed based on the linear-support vector machine. Model 1 was to classify benign and malignant LNs by one-versus-one approach. Model 2 was to further distinguish kikuchi disease, reactive hyperplasia, suppurative lymphadenitis and malignancy by one-versus-rest approach. Figure 1 displays the whole workflow of the study.
GLCM: Gray Level Co-occurrence Matrix, GLDM: Gray Level Dependence Matrix, GLRLM: Gray Level Run Length Matrix, GLSZM: Gray Level Size Zone Matrix, LASSO: Least Absolute Shrinkage and Selection Operator, LoG: Laplacian of Gaussian, ROC: Receiver Operating Characteristic, SVM: The Support Vector Machine, VOI: Volume of Interest.
2.5. Statistical Analysis
Statistical analysis was performed using R software version 4.1.3 (Link 2). Common comparisons of patient characteristics were conducted by one-way analysis of variance or Mann-Whitney U test for continuous variables. Pearson’s chi-squared test or Fisher’s exact test was used for categorical variables. The performance of models was quantified by the area under the curve (AUC) of receiver operating characteristic curves, accuracy, sensitivity, specificity. For the calculation of AUC in multi-class problems, each class was treated as the positive class and the other classes were treated as the negative class. Then, the average of the AUC scores for each class was taken. Decision curves were constructed to evaluate the potential net clinical benefits. All the levels of statistical significance were two-sided, and P-values < 0.05 were considered statistically significant.
3. Results
3.1. Demographic and Clinical Characteristics
A total of 419 enlarged LNs were detected in 146 patients (89 boys, 57 girls; with mean age of 8.2±3.8 years) in this retrospective study. Of all LNs, 147 were pathologically diagnosed as kikuchi disease, 131 were reactive hyperplasia, 44 were suppurative lymphadenitis and 97 were malignancy. Profiles of patients are given in (Table 1).
TABLE 1: Demographics
and clinical characteristics of patients.
|
|
Kikuchi
disease (n=43) |
Reactive
hyperplasia (n=49) |
Suppurative
lymphadenitis (n=25) |
Malignancy (n=29) |
Total (n=146) |
p |
|
Age
(mean ± SD) |
10.1±
2.9 |
6.6 ±
3.5 |
5.7 ±
4.0 |
10.2 ±
2.9 |
8.2 ±
3.8 |
<0.001 |
|
Gender |
|
|
|
|
|
0.014 |
|
Male
(n, %) |
26
(60.5) |
25
(51.0) |
13
(52.0) |
25
(86.2) |
89
(61.0) |
|
|
Female
(n, %) |
17
(39.5) |
24
(49.0) |
12
(48.0) |
4
(13.8) |
57
(39.0) |
|
|
Fever
(n, %) |
41
(95.3) |
35
(71.4) |
20
(80.0) |
7
(24.1) |
103
(70.5) |
<0.001 |
|
Fever
over 2 weeks (n, %) |
15
(34.9) |
5
(10.2) |
2
(8.00) |
1
(3.45) |
23
(15.8) |
0.001
|
|
Number
of enlarged
LNs (n, %) |
147
(35.1) |
131
(31.3) |
44
(10.5) |
97
(23.1) |
419
(100) |
|
|
Sites
of enlarged LNs |
|
|
|
|
|
<0.001 |
|
Unilateral
(n, %) |
7
(31.8) |
7
(20.0) |
14
(100.0%) |
11
(50.0) |
39
(41.9) |
|
|
Bilateral
(n, %) |
15
(68.2) |
28
(80.0) |
0
(0.0%) |
11
(50.0) |
54
(58.1) |
|
|
LN
tenderness (n, %) |
34
(79.1) |
24
(49.0) |
20
(80.0%) |
11
(37.9) |
89
(61.0) |
<0.001 |
|
LN heat
sense (n, %) |
4
(9.30) |
4
(8.16) |
7
(28.0%) |
0
(0.00) |
15
(10.3) |
0.010 |
|
WBC
counts (109/L) |
5.5 (3.7-10.2) |
3.8
(3.0-4.3) |
6.7
(5.8-12.6) |
15.7
(10.4-19.9) |
5.5
(5.4-6.9) |
<0.001 |
|
NE
counts (109/L) |
2.4
(1.6-6.3) |
1.6
(1.3-2.3) |
2.6
(1.7-7.4) |
9.7
(7.3-13.3) |
2.9
(2.1-3.9) |
<0.001 |
|
Neutropenia
(n, %) |
15
(34.9) |
7
(14.6) |
1
(4.00) |
1
(3.57) |
24
(16.7) |
0.001 |
|
CRP
(mg/L) [median (IQR)] |
8.0
(2.0-15.0) |
7.0
(1.3-45.7) |
21.0
(9.8-51.0) |
4.0
(1.0-15.2) |
8.0
(2.0-25.0) |
0.006 |
|
ESR
(mm/h) [median (IQR)] |
32.5
(23.8-45.0) |
35.0
(16.0-77.2) |
50.0
(34.5-57.8) |
10.0
(8.0-63.0) |
38.5
(20.8-55.5) |
0.284 |
CRP: C-reactive Protein,
ESR: Erythrocyte Sedimentation Rate, IQR: Interquartile Range, LN: Lymph Node,
NE: Neutrophil, SD: Standard Deviation, WBC: White Blood Count.
3.2. Distinguishing Benign and Malignant LNs
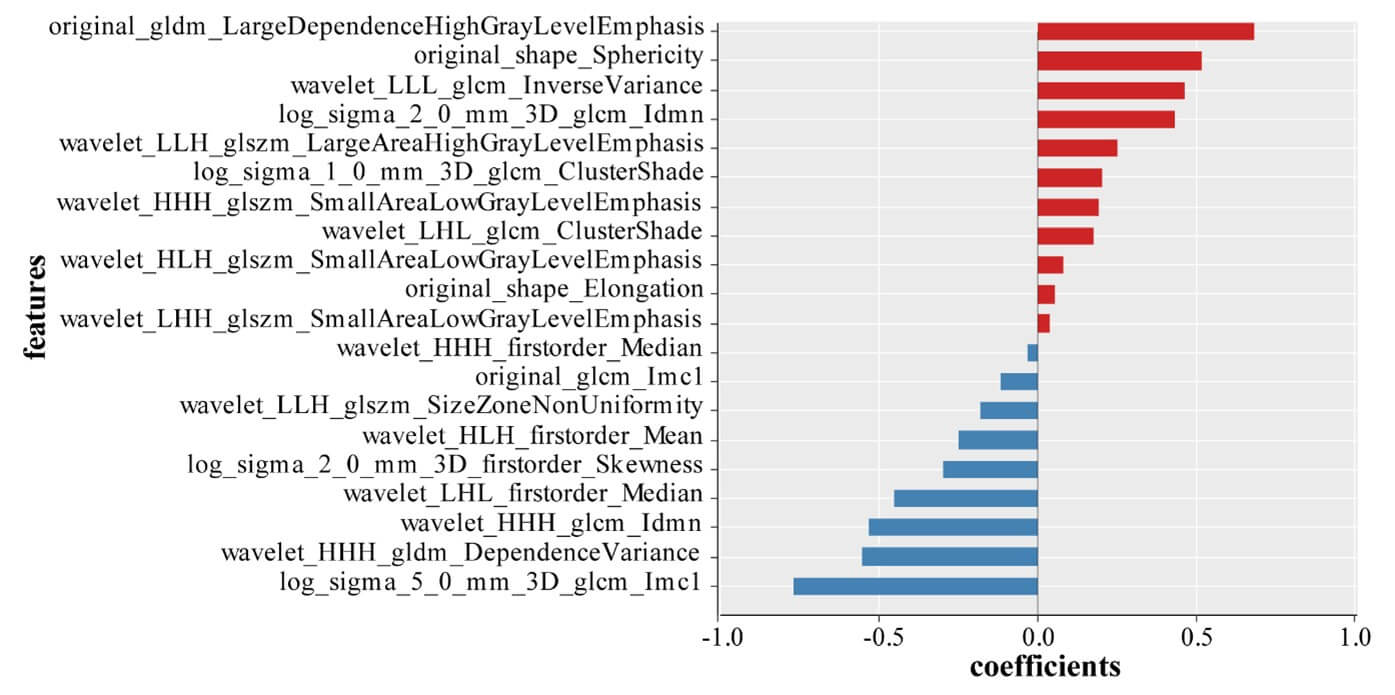
A good inter-observer agreement was observed with the interclass correlation coefficient of all the radiomics features were greater than 0.75. Model 1 was built on a basis of 322 benign nodes and 97 malignant nodes. After data reduction, 20 features were finally selected to construct the model by LASSO (Figure 2). Of those, 2 were shape features, 2 were texture features and the rest 16 were all high-ordered features. The selected features and their corresponding weights are presented in (Figure 3). Of those features, log sigma 5.0 mm 3D glcm Imc1 was ranked as the most important. The detailed interpretation of these features and a Rad-score calculation formula were presented in (Supplementary Material).
There was a significant difference of Rad-score between benign and malignant LNs in the training set (-2.80±2.46 vs 0.32±1.20, p < 0.001), and then confirmed in the testing set (-2.36±2.54 vs 0.24±1.98, p < 0.001). Malignant LNs generally had higher scores (Figure 4). Excellent performance was observed with an accuracy of 0.81(95% CI 0.76-0.85) and an AUC of 0.89 ((95% CI 0.86-0.93) in the training set, and accuracy of 0.70 ((95% CI 0.62-0.78) and AUC of 0.80 ((95% CI 0.71-0.89) in the testing set. Table 2 summarizes all the classification results including the sensitivity, specificity, positive predictive value, and negative predictive value in distinguishing benign and malignant LNs.
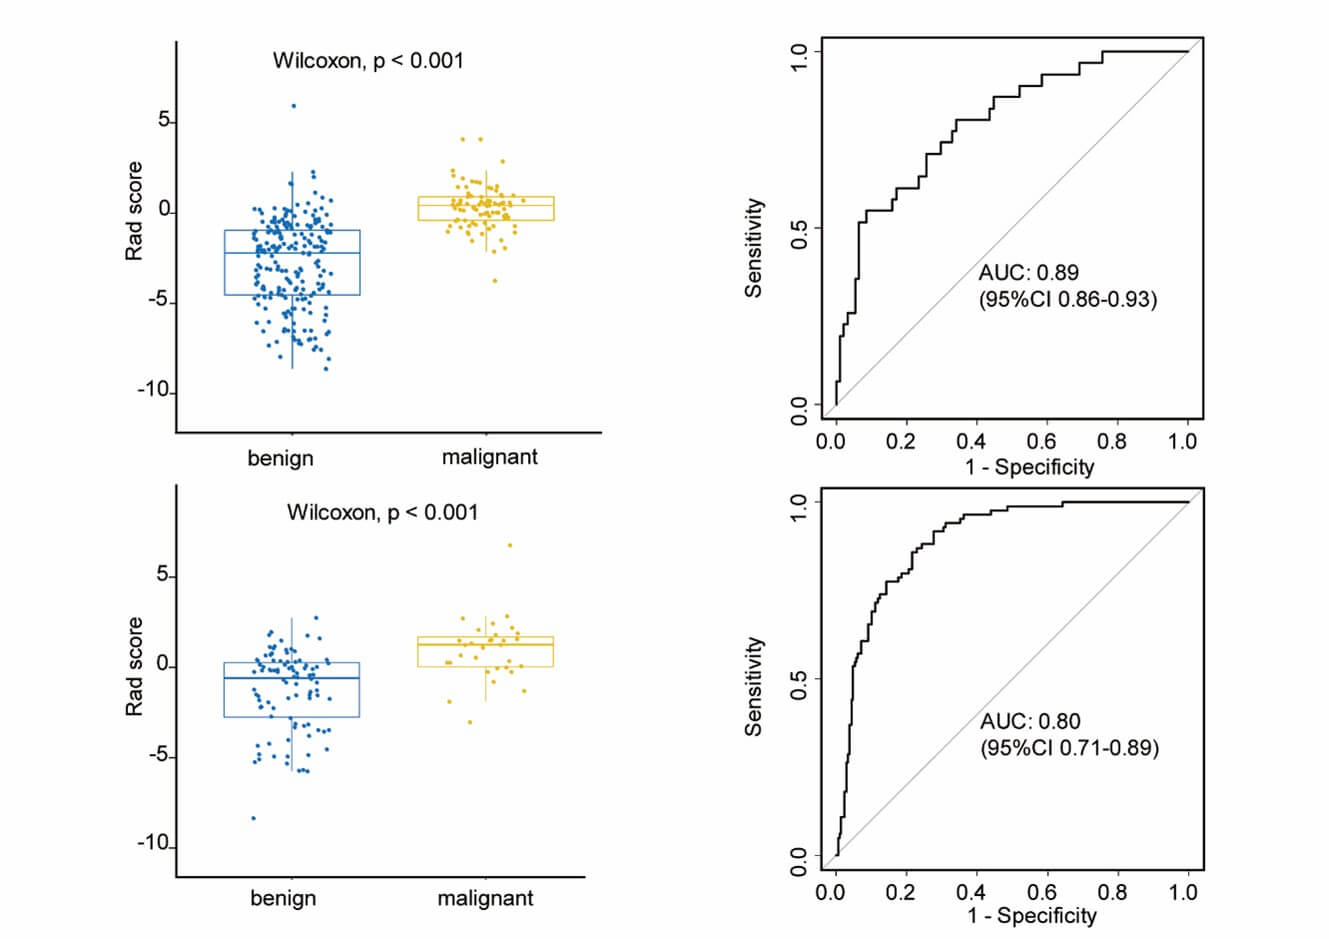
TABLE 2: Performance
of the radiomics model for the classification of benign and malignant cervical
LNs.
|
|
Accuracy(95%CI) |
Sensitivity
(%) |
Specificity
(%) |
Positive
predictive value |
Negative
predictive value |
|
Training
set |
0.81(0.76-0.85) |
0.86 |
0.79 |
0.62 |
0.93 |
|
Testing
set |
0.70
(0.86-0.93) |
0.71 |
0.70 |
0.44 |
0.88 |
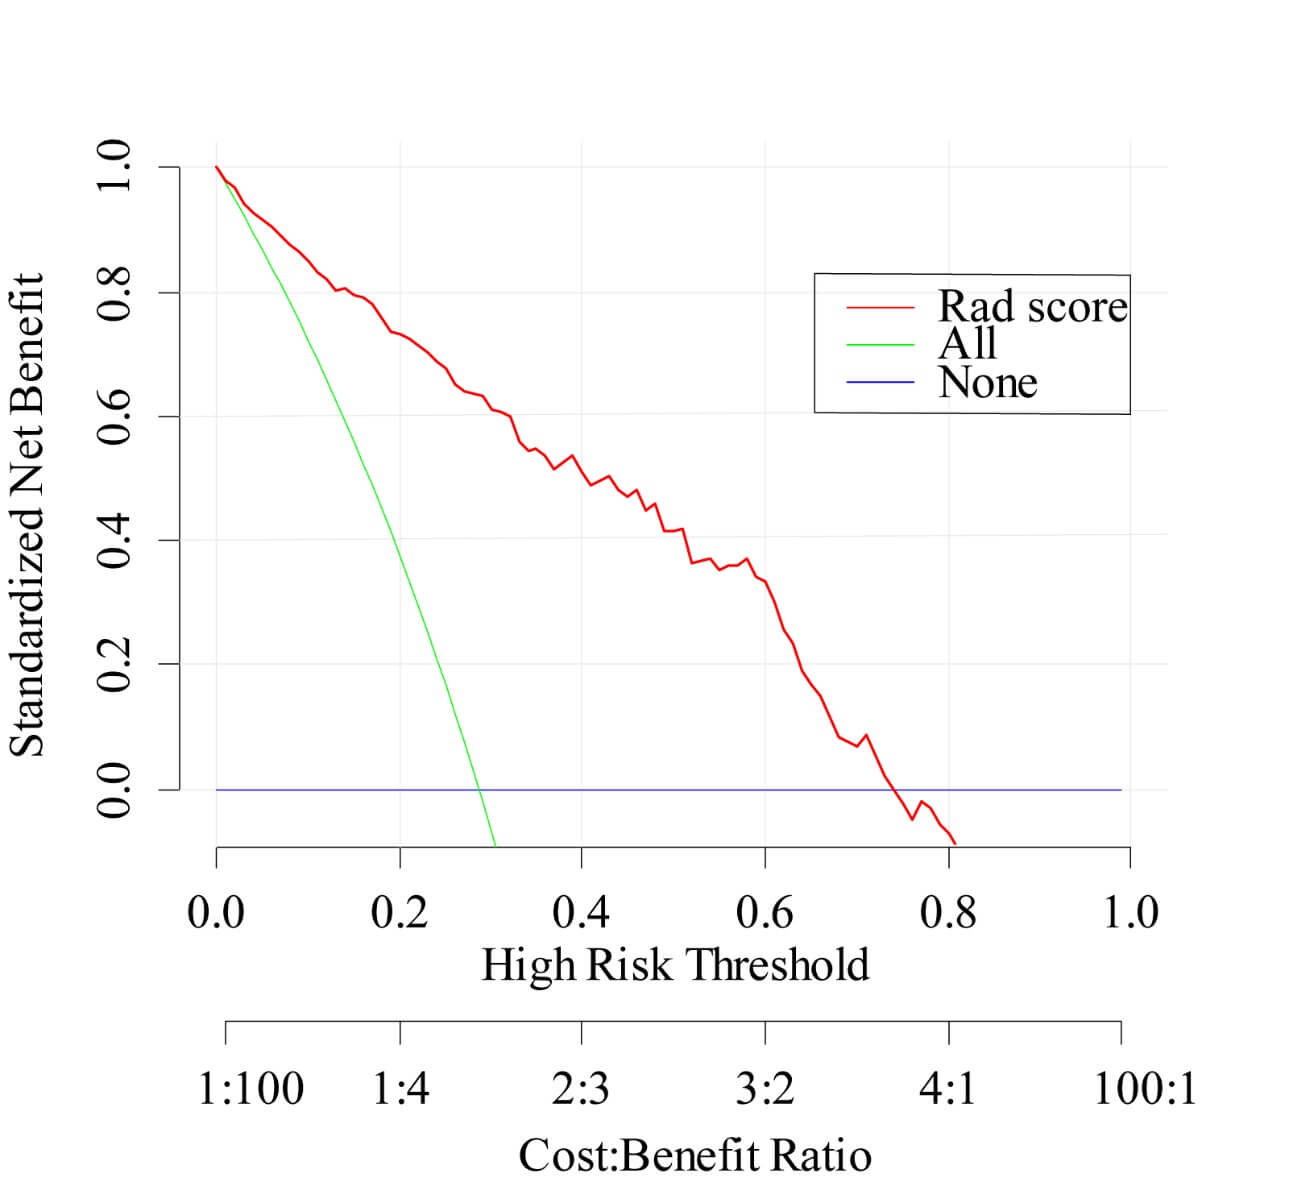
Decision curve analysis was performed to assess the clinical usefulness of model 1. Figure 5 showed that across the majority of the range of reasonable threshold probabilities, using model 1 to classify benign and malignant LNs would add more benefit than the treat-all-patients scheme or the treat-none scheme. For instance, if the threshold probability is 50% (in other words, the doctor would choose biopsy if the probability of malignancy was above 50%), then the net benefit is 0.41, with more than the treat-all scheme or the treat-none scheme, implying that a proportion of patients could benefit from this model.
3.3. Distinguishing Four Different Etiologies of LNs
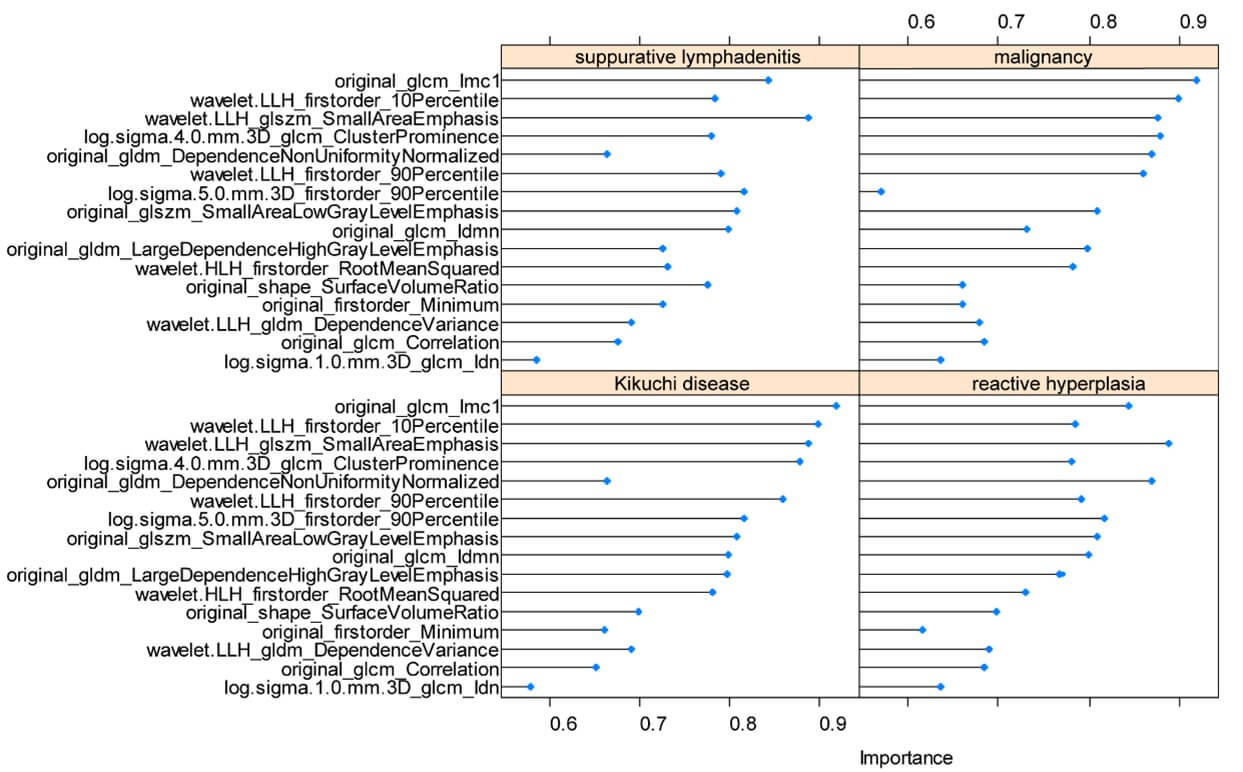
Model 2 was established on a basis of 147 kikuchi diseases’ LNs, 131 reactive LNs, 44 suppurative LNs and 97 malignant LNs. Finally, the 16 most useful features were retained by LASSO including 1 first-order feature, 1 shape feature, 6 texture features and 8 higher-order features (Figure 6). For distinguishing each etiology (kikuchi disease, reactive hyperplasia, suppurative lymphadenitis and malignancy respectively), an AUC of 0.97, 0.91, 0.88 and 0.87 was achieved in the training set, and an AUC of 0.96, 0.80, 0.82 and 0.82 was achieved in the testing set. Radiomics features yielded the highest AUC value for the differentiation of kikuchi disease from the other three etiologies both in the training and testing sets (Figure 7). Other detailed performance was shown in (Table 3).
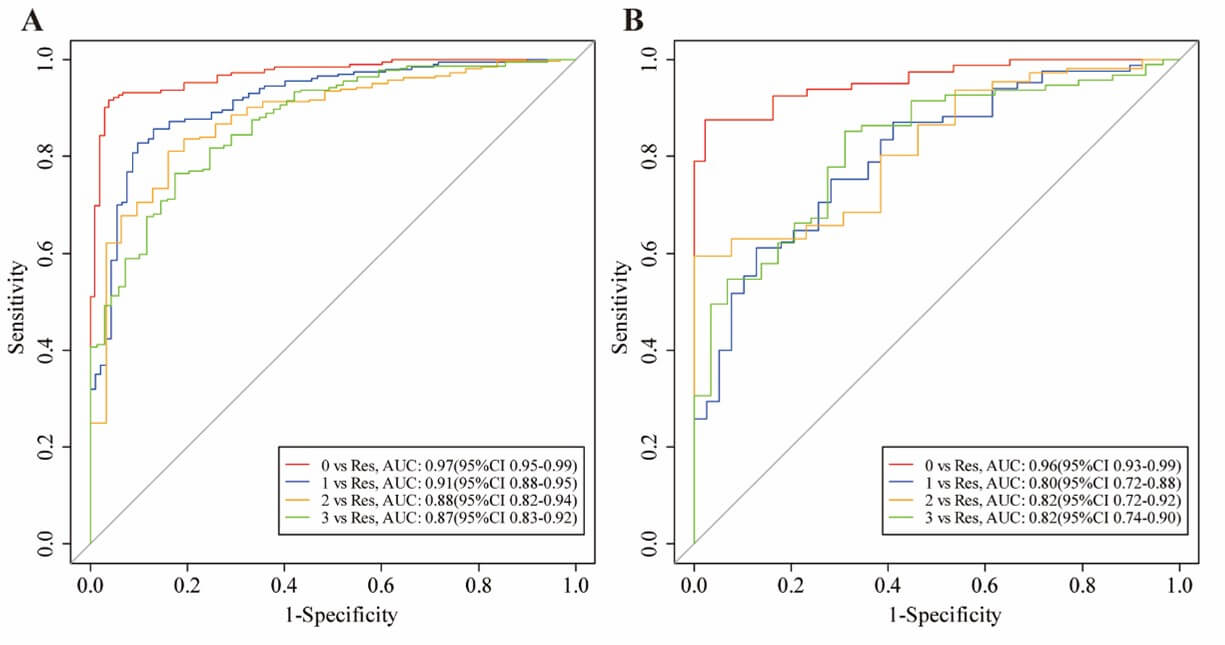
Class 0 represents Kikuchi disease; Class 1 represents reactive hyperplasia; Class 2 represents suppurative lymphadenitis; Class 3 represents malignancy.
TABLE 3: Performance
of the radiomics model for the classification of four different types of
cervical LNs.
|
|
Training
set |
Testing
set |
||||||
|
|
Kikuchi
disease |
reactive
hyperplasia |
suppurative
lymphadenitis |
malignancy |
Kikuchi
disease |
reactive
hyperplasia |
suppurative
lymphadenitis |
malignancy |
|
Accuracy(95%CI) |
0.93 (0.90-0.96) |
0.85 (0.80-0.89) |
0.81 (0.76-0.86) |
0.81 (0.73-0.88) |
0.91 (0.85-0.95) |
0.69 (0.60-0.77) |
0.64 (0.55-0.72) |
0.78 (0.73-0.83) |
|
Sensitivity
(%) |
0.96 |
0.90 |
0.83 |
0.85 |
0.88 |
0.61 |
0.59 |
0.83 |
|
Specificity
(%) |
0.92 |
0.83 |
0.81 |
0.77 |
0.98 |
0.87 |
1.00 |
0.69 |
4. Discussion
In this study, we preliminarily explored the feasibility of distinguishing pediatric cervical lymphadenopathy based on MR images. Two radiomics models were developed. Good performance was shown not only in distinguishing malignant from benign LNs (an AUC of 0.80 in the testing set), but also in distinguishing four different types of LNs (an AUC of 0.96, 0.80, 0.82, 0.82 in the testing set respectively). Especially, our model demonstrated a significant advantage on identifying kikuchi disease. This would be a promising noninvasive tool to assist the evaluation of cervical lymphadenopathy.
In routine clinical practice, radiologists use semantic characteristics to distinguish pathologic from benign LNs: size, shape, borders, clustering, and internal heterogeneity. Information provided is still limited and may influenced by viewer’s naked eyes. Radiomics, a high-throughput approach that extracts quantitative features from images and transforms them into mineable data [15], is independent from viewer’s experience and can dig out more subtle characteristics. Traditionally, size and shape are the most common criterion, a larger and rounder LN tends to be abnormal, however this may not be appliable to children as their LNs undergo physiologically hyperplasia. In a recent study of normal children, identifiable LNs in the head and neck were calculated and a mean of the short axis greater than 10 mm was reported [16]. Therefore, it may be more reliable to judge by its shape. However, the present measurement of shape is determined by a ratio of short and long axis, the result may vary with planes. In our study, the feature original shape sphericity was an important feature to classify benign and malignant LNs. By measuring how round the LN is in three-dimensional way, we were able to have a comprehensive understanding from the overall perspective rather than a single maximum section.
In addition, the feature log sigma 5.0 mm 3D glcm Imc1 had the highest impact on classification of benign and malignant LNs and original glcm Imc1 had the highest impact when classify kikuchi disease from the other three cervical lymphadenopathies. This is a reasonable finding as texture features have been known to measure internal heterogeneity and explain the spatial interdependence or cooccurrence of information between adjacent voxels [17]. GLCM is used to describe the joint distribution of two neighboring pixel gray scales with spatial location relationship. Imc1 is one of GLCM features that quantifies the complexity of the texture. Generally, greater complexity in heterogeneity implies a greater likelihood of malignancy, but for kikuchi disease, whose characteristic is varying degrees of necrosis with abundant karyorrhectic debris in paracortical areas, such intranodal necrosis is microscopic that often not apparent enough to be recognized by radiologists. In a CT characteristic analysis, nodal necrosis was reported in only 16.7% of patients with kikuchi disease [18], and in another MRI finding, necrosis which was shown in a hypointense manner on T2-weighted images was found in less than half kikuchi disease patients [19].
Moreover, our results partially confirmed the difficulty of visual identification by radiologist, for most of selected features belonging to high-order features. There is evidence that preprocessing filters can further decouple texture features [20]. By changing the ratio of signal frequency, wavelet filters could reduce the noise and achieve compact feature representation ,acting as an edge enhancement tool to emphasize areas of gray level changes [21], where a higher sigma value represents coarser textures, in other words, gray level changes over a larger distance. Our findings showed the subtle distinctions between LNs that can only be distinguished by de-noising and enhancing filters. With the help of our model, we can make up for the inadequacy of traditional reading.
Previous studies mainly focused on US images. Liu et al. developed a multiclass US-based radiomics model to classify LN tuberculosis, lymphoma, reactive and metastatic LNs with an AUC of 0.673, 0.623, 0.655 and 0.708 for each disease [22], and Zhu et al. built a hierarchical diagnosis model via deep residual network algorithm based on dual-modality US images (B-mode US and color Doppler flow imaging) [23]. There are also studies demonstrated the utility of CT-based radiomics classifier [24-26]. However, in most studies only one representative image was chosen and single-section of region of interest for each patient was segmented which resembles core needle biopsy that may not allow for a comprehensive profile of the entire LN. The strength of our study is VOIs ware manually drawn slice-by-slice at the entire LN’s boundary which carry more texture information. Therefore, we have a significant advantage in identifying kikuchi disease which has variable degrees of necrosis inside LNs.
The study has a few limitations. First, the retrospective nature may introduce selection biases. Second, suppurative lymphadenitis had difficulty in segmentation due to extensive diffusion on images, resulting in suboptimal accuracy in testing set. But, the prominent clinical signs of suppurative lymphadenitis like heat sense can make up for model’s shortcomings. Third, the lack of independent testing cohort raised a concern regarding potential generalizability of the proposed model, thus multicenter studies with larger patient numbers are required for further validation.
5. Conclusion
In summary, this study reveals that MR images contain much useful information which could be used in the classification of pediatric cervical lymphadenopathy. Our models may be promising noninvasive tools used as virtual biopsy, which is beneficial for early diagnosis.
Acknowledgments
We would like to thank Yaqiong Ge from GE Healthcare (Shanghai) for helping us with image preprocessing and all clinicians from Xinhua Hospital affiliated to Shanghai Jiao Tong University School of Medicine and the Children's Hospital affiliated to Zhejiang University School of Medicine for helping discussions on topics related to this work and acquiring data. This work was supported by the Hundred Talents Program of Zhejiang University [grant numbers CZ571].
Funding
This work was supported by the Hundred Talents Program of Zhejiang University [grant numbers CZ571].
Ethical Statement
The authors are accountable for all aspects of the work in ensuring that questions related to the accuracy or integrity of any part of the work are appropriately investigated and resolved. The study was conducted in accordance with the Declaration of Helsinki (as revised in 2013). The study was approved by ethics board of Children's Hospital of Zhejiang University School of Medicine and the informed consent requirement was waived.
Conflicts of Interest
None.
Competing Interests
None.
Disclosure
All authors have completed the ICMJE uniform disclosure form.
REFERENCES
[1] L O Larsson, M W Bentzon, K Berg
Kelly, et al. “Palpable lymph nodes of the neck in Swedish schoolchildren.” Acta
Paediatr, vol. 83, no. 10, pp. 1091-1094, 1994. View at: Publisher
Site | PubMed
[2] Elena Chiappini, Angelo Camaioni,
Marco Benazzo, et al. “Development of an algorithm for the management of
cervical lymphadenopathy in children: consensus of the Italian Society of
Preventive and Social Pediatrics, jointly with the Italian Society of Pediatric
Infectious Diseases and the Italian Society of Pediatric Otorhinolaryngology.” Expert
Rev Anti Infect Ther, vol. 13, no. 12, pp. 1557-1567, 2015. View at: Publisher Site | PubMed
[3] Michael S Weinstock, Neha A Patel,
Lee P Smith “Pediatric Cervical Lymphadenopathy.” Pediatr Rev, vol. 39,
no. 9, pp. 433-443, 2018. View at: Publisher Site | PubMed
[4] Mohammed Qaisi, Issam Eid “Pediatric
Head and Neck Malignancies.” Oral Maxillofac Surg Clin North Am, vol.
28, no. 1, pp. 11-19, 2016. View at: Publisher Site | PubMed
[5] Ionna Fragkandrea, John Alexander
Nixon, Paraskevi Panagopoulou “Signs and symptoms of childhood cancer: a guide
for early recognition.” Am Fam Physician, vol. 88, no. 3, pp. 185-192,
2013. View at: PubMed
[6] Isaac Schwartz, Charlotte Hughes,
Matthew T Brigger “Pediatric head and neck malignancies: incidence and trends,
1973-2010.” Otolaryngol Head Neck Surg, vol. 152, no. 6, pp. 1127-1132,
2015. View at: Publisher
Site | PubMed
[7] Israa Gism Elseed, Haitham Osman,
Osman Ahmedfiqi, et al. (2022) Kikuchi-Fujimoto Disease: A Rare Benign Cause of
Lymphadenopathy That Mimics Malignant Lymphoma. Cureus, vol. 14, no. 3,
pp. e23177, 2022. View at: Publisher
Site | PubMed
[8] R Ferrer “Lymphadenopathy:
differential diagnosis and evaluation.” Am Fam Physician, vol. 58, no.
6, pp. 1313-1320, 1998. View at: PubMed
[9] Tsung-Ying Ho, Chun-Hung Chao,
Shy-Chyi Chin, et al. “Classifying Neck Lymph Nodes of Head and Neck Squamous
Cell Carcinoma in MRI Images with Radiomic Features.” J Digit Imaging,
vol. 33, no. 3, pp. 613-618, 2020. View at: Publisher Site | PubMed
[10] Steven W Mes, Floris H P van Velden,
Boris Peltenburg, et al. “Outcome prediction of head and neck squamous cell
carcinoma by MRI radiomic signatures.” Eur Radiol, vol. 30, no. 11, pp.
6311-6321, 2020. View at: Publisher
Site | PubMed
[11] Hui Qin, Qiao Que, Peng Lin, et al.
“Magnetic resonance imaging (MRI) radiomics of papillary thyroid cancer (PTC):
a comparison of predictive performance of multiple classifiers modeling to
identify cervical lymph node metastases before surgery.” Radiol Med,
vol. 126, no. 10, pp. 1312-1327, 2021. View at: Publisher Site | PubMed
[12] Yuepeng Wang, Taihui Yu, Zehong Yang,
et al. “Radiomics based on magnetic resonance imaging for preoperative
prediction of lymph node metastasis in head and neck cancer: Machine learning
study.” Head Neck, vol. 44, no. 12, pp. 2786-2795, 2022. View at: Publisher Site | PubMed
[13] Ying Yuan, Jiliang Ren, Xiaofeng Tao
“Machine learning-based MRI texture analysis to predict occult lymph node
metastasis in early-stage oral tongue squamous cell carcinoma.” Eur Radiol,
vol. 31, no. 9, pp. 6429-6437, 2021. View at: Publisher Site | PubMed
[14] Alex Zwanenburg, Martin Vallières,
Mahmoud A Abdalah, et al. “The Image Biomarker Standardization Initiative:
Standardized Quantitative Radiomics for High-Throughput Image-based
Phenotyping.” Radiology, vol. 295, no. 2, pp. 328-338, 2020. View at: Publisher Site | PubMed
[15] Robert J Gillies, Paul E Kinahan,
Hedvig Hricak “Radiomics: Images Are More than Pictures, They Are Data.” Radiology,
vol. 278, no. 2, pp. 563-577, 2016. View at: Publisher Site | PubMed
[16] J Alves Rosa, J S Calle-Toro, M Kidd,
et al. “Normal head and neck lymph nodes in the paediatric population.” Clin
Radiol, vol. 76, no. 4, pp. 315.e1-315.e7, 2021. View at: Publisher Site | PubMed
[17] Meghan G Lubner, Andrew D Smith,
Kumar Sandrasegaran, et al. “CT Texture Analysis: Definitions, Applications,
Biologic Correlates, and Challenges.” Radiographics, vol. 37, no. 5, pp.
1483-1503, 2017. View at: Publisher
Site | PubMed
[18] Soon-Young Kwon, Taik-Kun Kim,
Young-Sik Kim, et al. “CT findings in Kikuchi disease: analysis of 96 cases.” AJNR
Am J Neuroradiol, vol. 25, no. 6, pp. 1099-1102, 2004. View at: PubMed
[19] Hiroki Kato, Masayuki Kanematsu,
Zenichiro Kato, et al. “MR imaging findings of cervical lymphadenopathy in
patients with Kikuchi disease.” Eur J Radiol, vol. 80, no. 3, pp.
e576-e581, 2011. View at: Publisher
Site | PubMed
[20] Philippe Lambin, Emmanuel
Rios-Velazquez, Ralph Leijenaar, et al. “Radiomics: extracting more information
from medical images using advanced feature analysis.” Eur J Cancer, vol.
48, no. 4, pp. 441-446, 2012. View at: Publisher Site | PubMed
[21] Nilanjan Dey, Amira S. Ashour,
Fuquian Shi, et al., “Soft Computing Based Medical Image Analysis. “Academic
Press, pp. 149-160, 2018.
[22] Yajing Liu, Jifan Chen, Chao Zhang,
et al. “Ultrasound-Based Radiomics Can Classify the Etiology of Cervical
Lymphadenopathy: A Multi-Center Retrospective Study.” Front Oncol, vol.
12, pp. 856605, 2022. View at: Publisher Site | PubMed
[23] Yangyang Zhu, Zheling Meng, Xiao Fan,
et al. “Deep learning radiomics of dual-modality ultrasound images for
hierarchical diagnosis of unexplained cervical lymphadenopathy.” BMC Med,
vol. 20, no. 1, pp. 269, 2022. View at: Publisher Site | PubMed
[24] Yarab Al Bulushi, Christine
Saint-Martin, Nikesh Muthukrishnan, et al. “Radiomics and machine learning for
the diagnosis of pediatric cervical non-tuberculous mycobacterial
lymphadenitis.” Sci Rep, vol. 12, no. 1, pp. 2962, 2022. View at: Publisher Site | PubMed
[25] Matthew Seidler, Behzad Forghani, Caroline Reinhold, et al. “Dual-Energy CT Texture Analysis With Machine Learning for the Evaluation and Characterization of Cervical Lymphadenopathy.” Comput Struct Biotechnol J, vol. 17, pp. 1009-1015, 2019. View at: Publisher Site | PubMed
[26] Wentao Zhang, Jian Peng, Shan Zhao, et al. “Deep learning combined with radiomics for the classification of enlarged cervical lymph nodes.” J Cancer Res Clin Oncol, vol. 148, no. 10, pp. 2773-2780, 2022. View at: Publisher Site | PubMed